

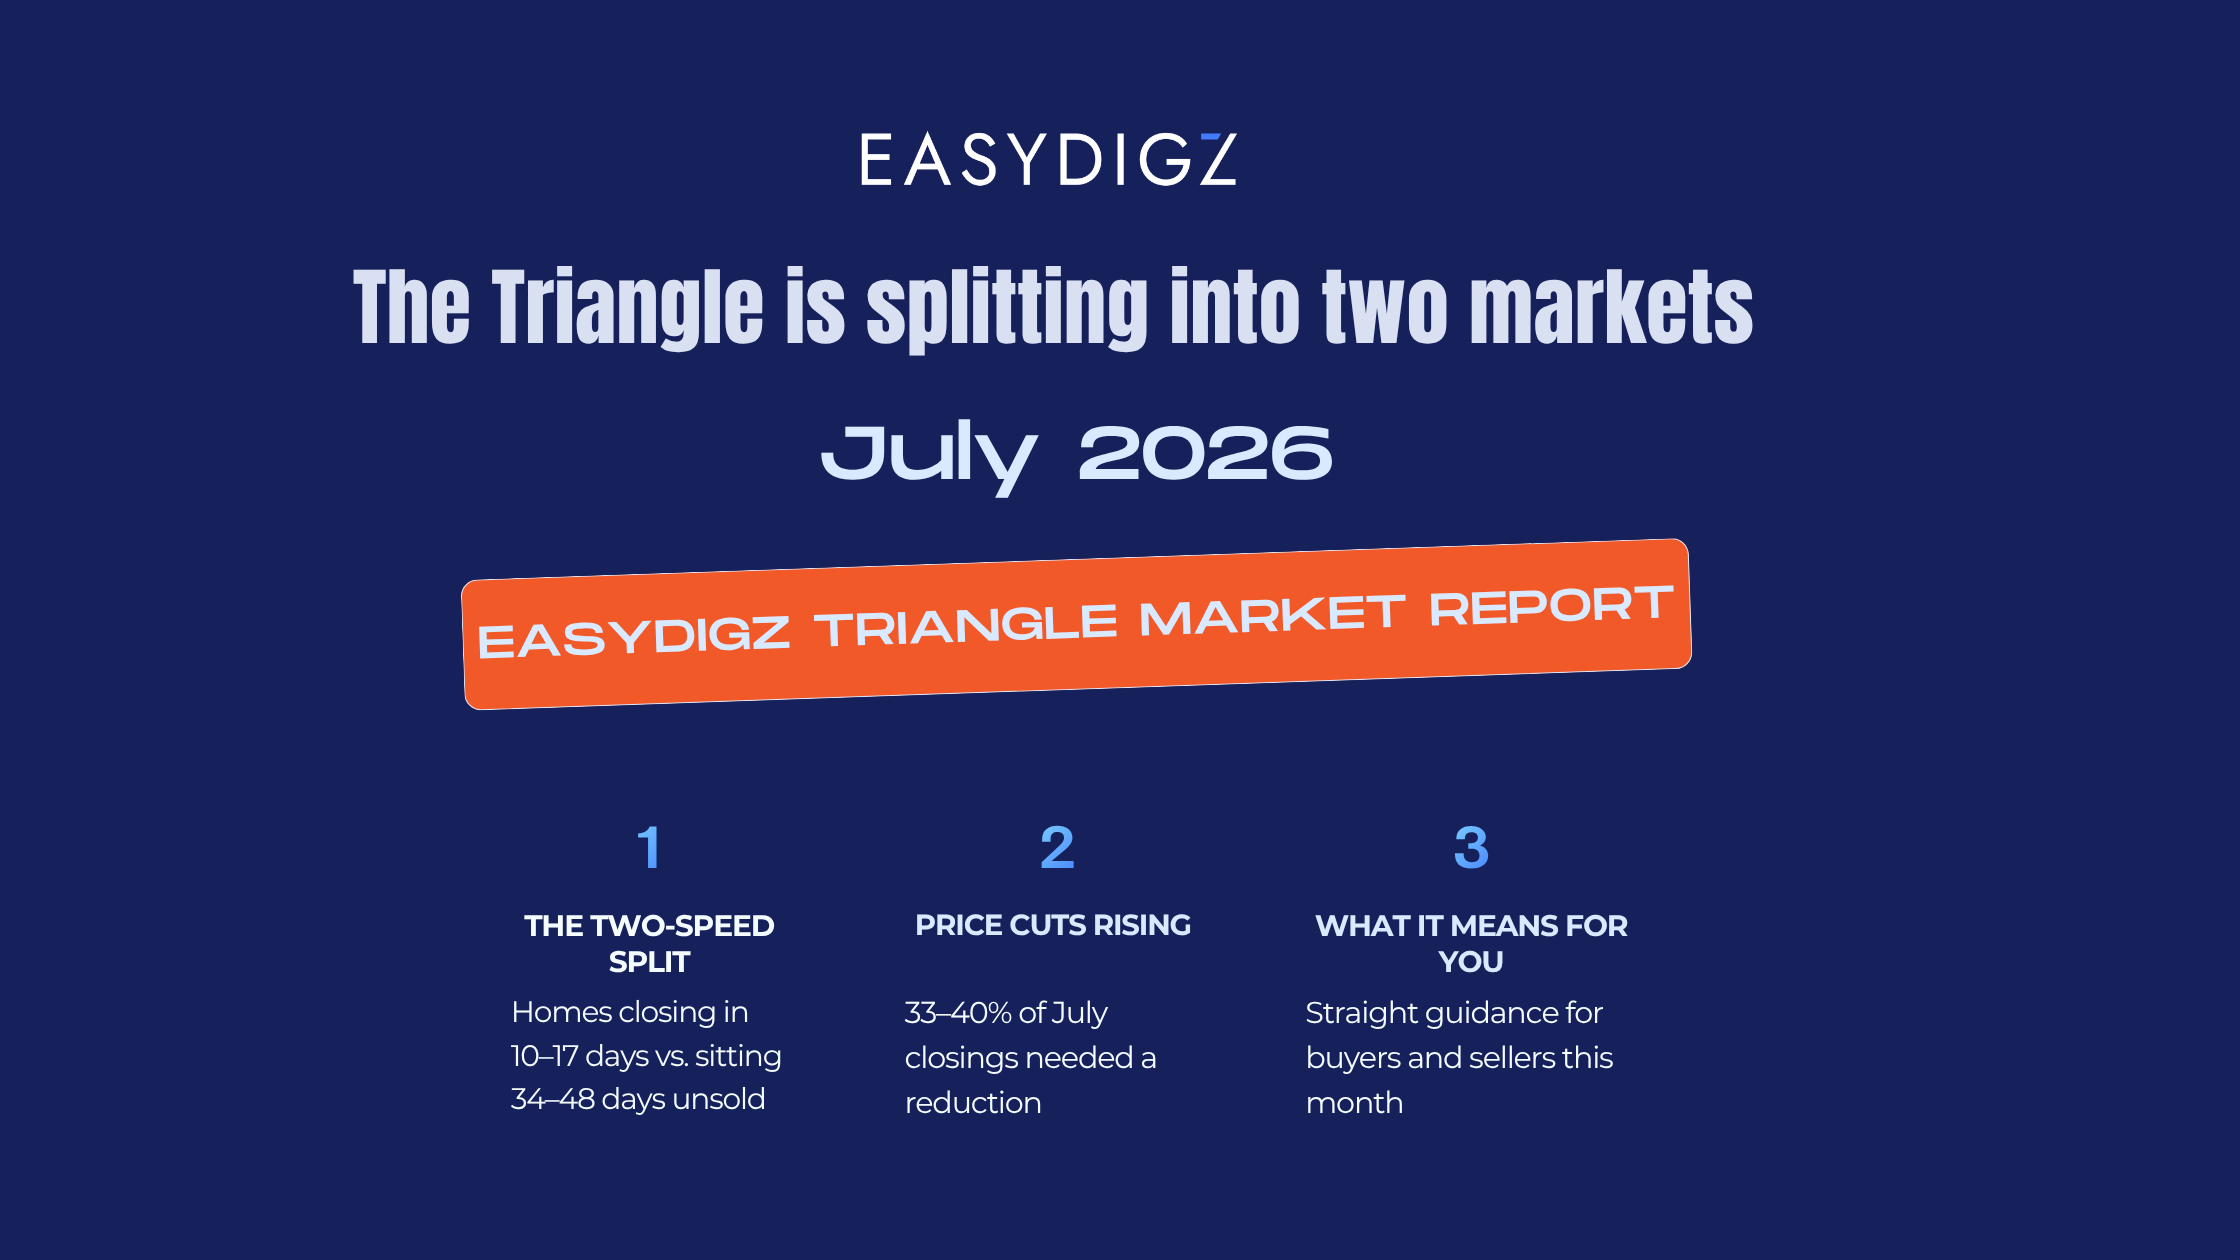
The Triangle Is Splitting Into Two Markets. Here's How to Tell Which Side You're On.
A home in the Triangle sold last month in ten days. Another sat for nearly seven weeks. Both sellers were real, both listings were live, and the difference between them had nothing to do with luck. It had everything to do with price. That divide, between homes that move quickly and homes that stall, is the defining feature of the Triangle market this month, and it reveals more about where things stand than any single headline number could on its own.
A Market Moving at Two Speeds
Across Wake, Durham, and Orange counties, homes that closed in July did so quickly, a median of ten to seventeen days depending on the county. That pace rivals anything the region has seen in recent memory. Yet the homes still active and unsold tell a very different story: a median of thirty-four to forty-eight days on the market, roughly three times as long.
This is not two markets operating in two places. It is one market, cleanly divided by a single factor: whether a home was priced for today's buyer or priced for a buyer who no longer exists.
The data reinforces this from a second angle. Of everything that closed last month, somewhere between a third and nearly half required at least one price reduction along the way. That is not noise. It is a pattern, and a telling one. Sellers who price ambitiously and wait are increasingly finding they arrive at the same number eventually, just later, and after the listing has lost the momentum only a fresh debut on the market can offer.
What the Numbers Show
According to EasyInsight, powered by Doorify MLS transaction data:
Median Closed Price | Days to Close | Active Listings Still Waiting | |
|---|---|---|---|
Wake County | $485,000, down 1% from a year ago | 10 days | 34 days |
Durham County | $409,990, down 7% from a year ago | 13 days | 36 days |
Orange County | $575,000, up 20% from a year ago | 17 days | 48 days |
Durham shows the most genuine softening of the three, price down against both June and a year prior. Wake holds remarkably steady, essentially flat year over year, while continuing to move at pace. Orange County's swings are larger, worth noting since fewer transactions occur there each month.
Zooming Into the Cities, the Split Gets Sharper
Look past the county level and into individual cities, and the two-speed pattern doesn't soften, it intensifies. Here too, the figures come from EasyInsight, powered by Doorify MLS data:
Median Closed Price | Days to Close | Active Listings Still Waiting | |
|---|---|---|---|
Raleigh | $448,000 | 17 days | 57 days |
Durham (city) | $408,245 | 12.5 days | 49 days |
Cary | $624,700 | 9.5 days | 69 days |
Chapel Hill | $661,250 | 12.5 days | 58 days |
Cary tells the story most vividly. Homes that sold there in July closed in a median of 9.5 days, among the fastest pace anywhere in the Triangle. But the homes still sitting active in Cary have been waiting a median of 69 days, more than seven times as long. Raleigh shows the same shape at a smaller scale, a 17-day close time against a 57-day wait for what hasn't sold. The pattern holds in every city measured: the properties moving fast and the properties stuck aren't a coincidence of geography, they're a direct reflection of how each was priced.
For Sellers, the Lesson Is Precision
The takeaway from July is not that the market has weakened. It is that the market has become more exacting. A home priced to reflect what buyers are actually paying today will likely move in under two to three weeks, in nearly any city in the Triangle. A home priced to reflect what a seller hopes buyers might pay will probably still sell, but only after losing the advantage a new listing carries, and often at the very price a fair valuation would have suggested from the start. Getting the number right on day one has become less a courtesy and more a strategy.
For Buyers, Patience Has Regained Its Value
With 4,316 active listings in Wake, 1,163 in Durham, and 454 in Orange as of the end of July, buyers have more to choose from than they have in some time, and little reason to move on the first option that fits. The listings most worth a closer look are often the ones that have already sat for a month or longer. Those sellers have typically recalibrated their expectations, and with homes closing at ninety-six to ninety-eight percent of list price across the region, there is meaningful room to negotiate well beyond the obviously stale listings.
The Larger Picture
What this month's data describes is not a market in distress, but a market recalibrating. The easy momentum of recent years, list ambitiously and let a bidding war do the work, has quietly given way to something more disciplined: a market that rewards accuracy and has little patience for guesswork.
Financing helps explain why. According to Freddie Mac's Primary Mortgage Market Survey (PMMS), the weekly national benchmark published by the federally chartered mortgage enterprise, the average 30-year fixed mortgage rate stood at 6.69% as of August 6, 2026, higher than the 6.63% recorded the same week a year earlier. Freddie Mac's own chief economist noted in that release that while rates continue to shape affordability, the broader housing market is adjusting, with listing prices modestly below year-ago levels and inventory improving from the tight supply of recent years. That national backdrop lines up closely with what the Triangle's own numbers show this month: buyers weighing a higher borrowing cost are being more selective, and sellers who don't account for that with realistic pricing are the ones left waiting.
A Note on This Data
Figures on closed sales reflect residential transactions in Wake, Durham, and Orange counties, and separately in Raleigh, Durham (city), Cary, and Chapel Hill, for July 2026, measured against June 2026 and July 2025 where noted, sourced from EasyInsight and powered by Doorify MLS data. Closed-sales sample sizes: Wake 1,539, Durham County 379, Orange County 145, Raleigh 520, Durham city 314, Cary 186, Chapel Hill 98. Smaller samples, particularly Orange County, Cary, and Chapel Hill, should be read as directional given lower transaction volume. Active inventory and active-listing days-on-market are shown as point-in-time figures as of July 31, 2026, rather than a month-over-month comparison, since historical inventory reconstruction is currently under review for accuracy. Mortgage rate context is sourced separately from Freddie Mac's Primary Mortgage Market Survey, dated August 6, 2026.
Curious what this looks like for your neighborhood or price range specifically? Reach out to EasyDigz, and we will walk through it with you.